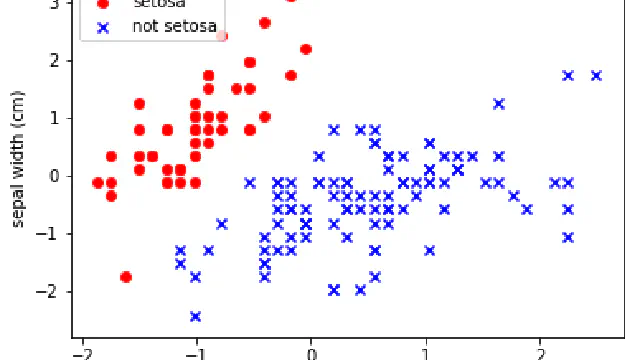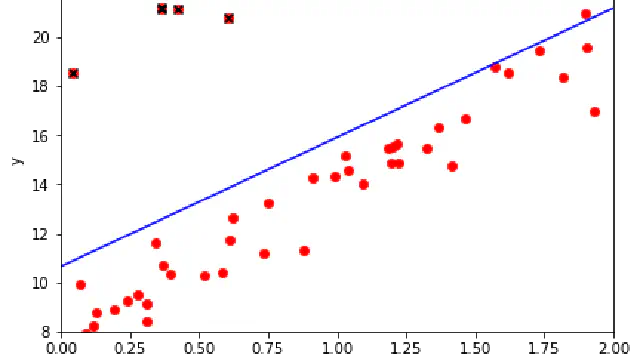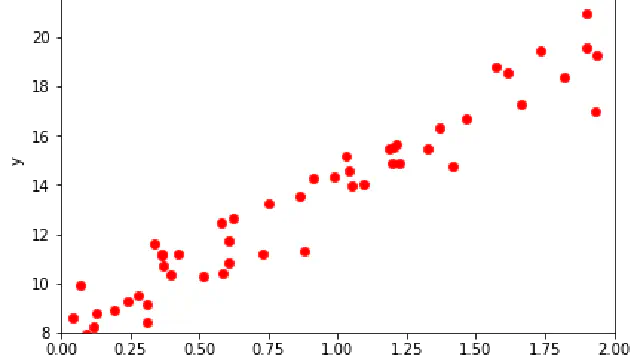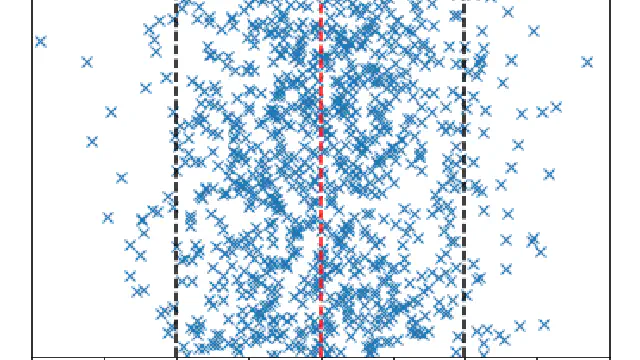
Visualising Underfitting and Overfitting in High Dimensional Data
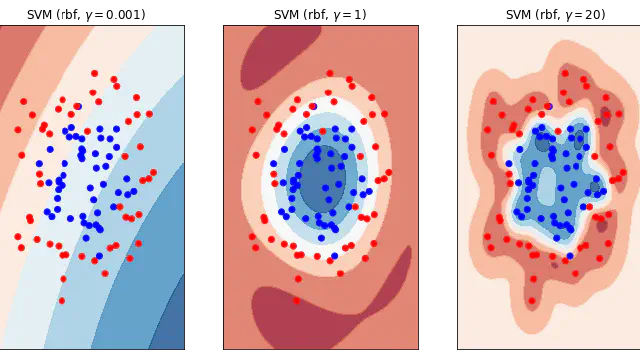
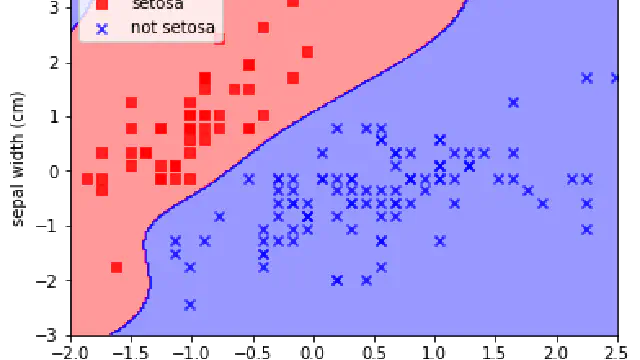
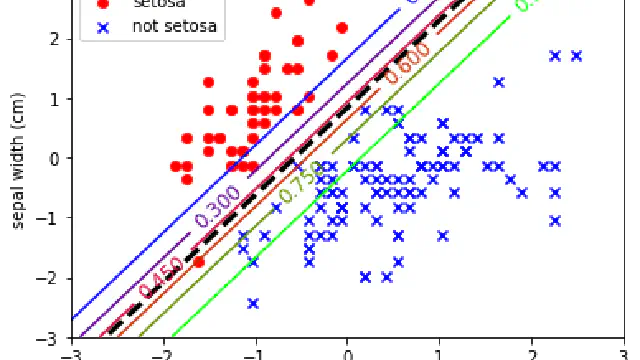
Most of the time you have too many dimensions to simply plot the decision boundary of a classifier. This workshop investigates other ways to visualise under and overfitting in high-dimensional datasets.