Save 80% of Your Machine Learning Training Bill on Kubernetes
by Dr. Phil Winder , CEO
Winder.AI worked with Grid.AI to stress test managed Kubernetes services with the aim of reducing training time and cost. A summary of this work includes:
- Stress testing the scaling performance of the big three managed Kubernetes services
- Reducing the cost of training a 1000-node model by 80%
- The finding that some cloud vendors are better (cheaper) than others
The Problem: How to Minimize the Time and Cost of Training Machine Learning Models
Artificial intelligence (AI) workloads are resource hogs. They are notorious for requiring expensive GPUs and large numbers of machines to train complex models on large datasets in a reasonable amount of time.
To reduce the time it takes to train a large model - large in terms of model complexity or amount of data - you have to scale the workload horizontally across many nodes. But it often takes a lot of time to scale up and down. The built-in scalability offered by cloud machine learning frameworks tends to be expensive and inflexible.
Kubernetes, however, has a simple, fast and effective scaling mechanism. OpenAI has demonstrated scaling a cluster to 7,500 nodes, but they used a custom cluster with Azure VMs.
For most companies we work with, we recommend leveraging a managed Kubernetes service like GKE (GCP), EKS (AWS), or AKS (Azure), to reduce the operational burden. How well does each cloud handle machine learning workloads that result in rapidly changing cluster sizes?
The Solution: Winder.AI’s Unique Cloud-Native AI Experience
Winder.AI is unique in that we have experience in both developing and operating AI applications and developing cloud-native solutions. This puts us in a perfect position to experiment with managed cloud Kubernetes services with machine learning applications in mind.
Methodology
We developed Terraform code to deploy equivalent Kubernetes clusters to GKE, EKS, and AKS. Using infrastructure as code allowed us to deploy consistent clusters and codify custom settings.
To test each service we used a small simulated ML Kubernetes job with the affinity set to force each pod onto a new node. This kicked the cluster auto-scaler running on each of the cloud vendor’s master nodes to request new nodes to be added to an autoscaling node pool. The job consisted of a 10-minute sleep.
Whilst the cluster was scaling we monitored progress via our Prometheus-based monitoring solution. We used these traces to evaluate the performance of each cloud.
Background
The Kubernetes Cluster Autoscaler is responsible for adding nodes to autoscaling groups. Although the same cluster auto-scaler codebase is used in all clouds, they use cloud-specific backend implementations. This leads to differences in performance.
Furthermore, they are deployed in slightly different ways. This leads to differences in how you access and alter the cluster auto-scaler.
In general, we are worried that suddenly adding thousands of nodes to the cluster will lead to overloading the master nodes with too much work, which might lead to failures.
Results
Throughout our experiments, we encountered a range of issues. Some of these are avoidable with better settings but some are intrinsic to the cloud vendor implementations. This produced a shocking result that if you use certain clouds for ML training workloads on Kubernetes, you will end up paying more money. Find out which cloud is best later in this case study.
General Issues
But first, here’s a selection of learnings that will help your heavy scaling needs.
Docker Hub Rate Limits
When you apply for a big scaling job it results in many new nodes being added in parallel. When many nodes all start at the same time, they all need to pull the container at roughly the same time, because the container doesn’t reside on the node yet.
If you use a container that resides in Docker Hub, you will be rate-limited if you do not have a commercial license. This has the effect of nodes being ready for workloads, but the pods will back off from pulling the container.
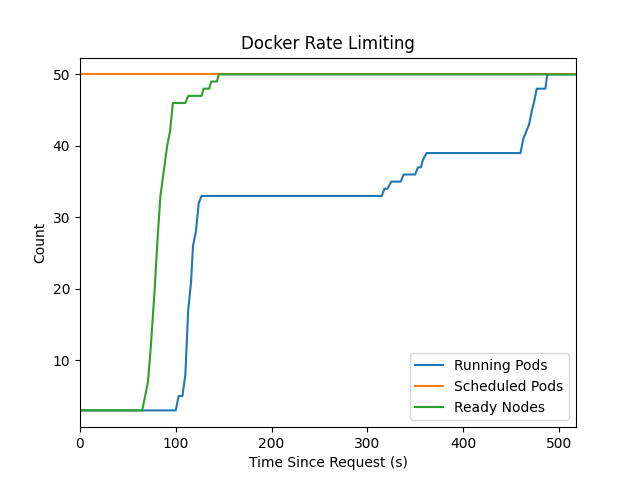
The image below shows a plot of an experiment where I made a request that resulted in 50 new nodes. (Note that was before I standardized the start time, so don’t compare this to other plots).
You can see that despite nodes being ready, pods went through a phase of stable launches until at about 35 nodes they suddenly stop. This was because I was using a docker hub image and the rate limit kicked in. For all subsequent tests, I used images from Quay.
Not Enough Room in the Subnet
I ran out of IP addresses because the subnet was too small. Most examples default to using subnets with 256 available addresses (10.0.0.0/24). Most vendors use these virtual subnets for pods too, so you will quickly run out of room. I run out of room after adding about 100 nodes.
Node Ready Time
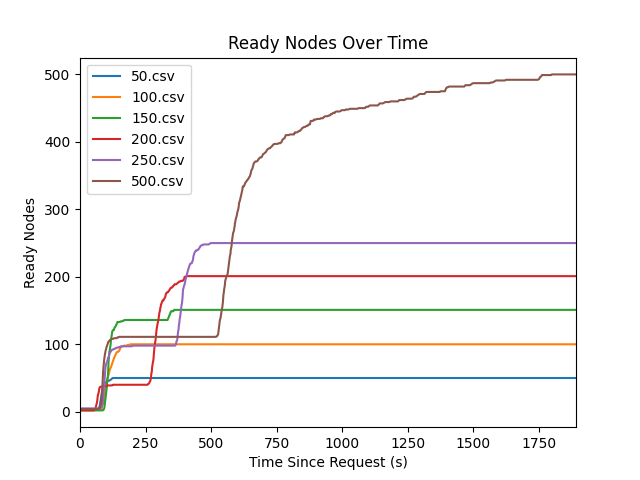
The image below shows the evolution of nodes becoming “Ready” over time. You can see that it takes approximately 3 minutes after the initial request before a Node becomes ready. This time is due to the provisioning and launch time of the node.
Note that this time is not guaranteed. Different node types with different add-ons have different start times. Also, as you add more nodes, the chances of having one node fail to start increases.
For 50 and 100 node scaling tests, you can see that there is an exponential ramp-up of the number of nodes. For the 150+ tests, there are discontinuities.
Key understanding: When you request many nodes in a cloud, you expect to get them. But in reality, there is a small, but significant chance that some won’t start or will be significantly delayed. The cluster auto-scaler settings expose controls to decide what to do when failures occur. In our case, the default settings are too conservative and prevent speedy scale-up/down.
Key Cluster Autoscaler Settings
The result of this is that there are a few key settings in the cluster auto-scaler that you need to be aware of.
max-total-unready-percentage: How many machines are allowed to be not ready at one time, in percent. If greater than this then scaling stops. This causes discontinuities in scale-up since all nodes go through a not ready phase. When you request a large number of nodes, it’s likely that some high proportion will be not ready at the same time.ok-total-unready-count: Maximum number of unready nodes. This is usually set really low. You will certainly have many nodes that are not ready at the same time.max-empty-bulk-delete: Maximum number of machines deleted at once. This usually defaults to a low number, in case there are failures during deletion. You’ll want to increase this to improve the scale down speed.
Cloud Specific Findings
Each of the cloud vendors works in a similar way but provides a different experience. This section discusses the particularities of each cloud.
AWS EKS
- Nodes per cluster: 30 x 450 = 13500
- Nodes per node pool: 450
- Pods per node: 110
- K8s API rate limit: ???
EKS exposes the cluster auto-scaler directly because you have to install it yourself. This is a benefit because it is the standard experience and you can edit settings directly via the GitOps code. The downside is that it doesn’t autoscale out of the box and is a bit fiddly to set up.
During these tests, remember that it also takes time to communicate with the Kubernetes API. For example, it takes roughly 1 minute for a 1000 pod job to get scheduled.
Results
The performance is generally good, but you do have to tweak the settings to get the best performance. Once you have, you can scale up and down to 1000 nodes in about 45 minutes as shown in the plot below.

The biggest drag in this experiment is the delay in starting the pod. Note how the nodes are starting relatively quickly, but the pods are starting at a different rate. Related to this, the nodes are really slow to delete.
In most (all?) backend implementations, this is because the auto-scaler tells the cloud API to delete a node on a node-by-node basis. It does not do it in batch. This means that a combination of the time it takes for the auto-scaler to run a full pass and the vendor’s API rate limits slow the deletion down to a snail’s pace.
Using multiple node pools helps a little because different node pools can operate in parallel.
For the best performance, consider using the following settings:
scale-down-unneeded-time: 1m0s # Scale down when unneeded for this amount of time
scale-down-delay-after-failure: 0s # Delay after scale-down failure
scale-down-delay-after-delete: 0s # Amount of time to delay after delete event.
new-pod-scale-up-delay: 1m0s # Wait for pod creation before creating nodes
GCP GKE
- Nodes per cluster: 15000
- Pods per cluster: 150000
- Nodes per nodepool: 1000
- Pods per node: 110
- K8s API rate limit: 3000 requests / min, enforced every 100 s
GKE doesn’t expose the auto-scaler settings directly. Instead, they go for a higher level “autoscaling profile” which is an enum that (presumably) describes some standard concoction of cluster auto-scaler settings. The profile called optimize-utilization talks about removing nodes quicker and being designed for batch workloads, so it makes sense to use this one here.
The cluster auto-scaler logs are saved to GCP stackdriver. Note that the logs here are akin to AKS’s cluster auto-scaler status config map. It reports the auto-scaler status, not the full log.
Watch Out For
CPU limits are the first to be hit (default to 600 CPUs). After this point, GKE will get trapped in Repairing the cluster mode as it continuously tries to scale up. Then you’ll probably hit persistent disk storage limits for all those nodes.
Enabling “Optimize Utilization” Mode
This mode is only available in beta, which means that you must use the google-beta terraform provider version.
Results
With the default, non-beta cluster enabled, performance was laggy. There were a variety of delays both on the scale-up and scale down. It took approximately 1 hr 30 min to complete a 1000 node batch job. An example run is show below:

These results are consistent with the other cloud providers using the default cluster autoscaler settings.
The two plots below are results from a 1000 node batch job using a cluster with the beta cluster autoscaling options enabled, using the “Optimize Utilization” profile. The plots above and below have the same x-scale.


You can see the massive decrease in the amount of time it takes to perform an experiment. Approximately 30-40 minutes. This is at least twice as fast as all the other cloud vendors.
Although the documentation doesn’t go into detail, I suspect this is a highly tuned version of the same cluster auto-scaler. E.g. timeouts are reduced and batch delete sizes are increased. But Google-specific tweaks may be at play here.
This result leads to the obvious recommendation:
- Use a beta GKE cluster that allows you to specify the
OPTIMIZE_UTILIZATIONauto-scaler profile.
GKE API Latency
Throughout some of these experiments, the latency of the kubectl API was increased. Google is explicit that they rate limit API requests (3000 / min) and I believe that I am being rate limited here.
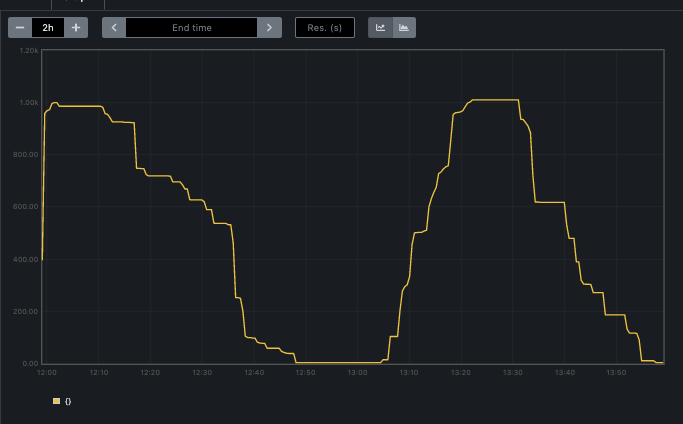
The plot below shows the API latency spike when large numbers of pods are trying to start. It returns to normal once the majority of pods have been completed.

Kubectl lag was observed in other clouds, but not to this extent.
Note that this does not hamper the operation or the timeliness of the jobs themselves. It only affects access to the Kubernetes API.
Fixing GKE API Latency
Other clouds benefited from using multiple node pools. In the following experiments, I used 5 pools of 200 nodes.
This successfully reduced the API latency to significantly lower levels than before, so I believe that google cloud API requests from the master are spread out across node pools, which ultimately helps with final API latency.
The images below show the results of this experiment.


The usage of multiple pools allows for redundancy against failures in other pools. So you tend to see a smoother ramp-up and ramp-down. This results in possibly the fastest test yet at about 30 minutes. This is really close to the theoretical minimum of approximately 5min start, 10 min test, 10 min cool-off, and 5 min stop totalling 30 min, although the settings are not visible so the cool-off may be set lower.
Therefore, it is recommended that you use many pools.
And this makes GKE the cloud with the most performant auto-scaling.
Azure AKS
When we first started our tests, AKS was completely unable to scale to any meaningful number of nodes.
And in general, I don’t good things to say about Microsoft support. But in this case, I was put in touch with a really knowledgeable and effective engineer from the AKS team that was quickly able to diagnose their issues like this one, inconsistent reporting of the number of nodes in your cluster.
After a couple of new releases of AKS, it was able to scale well enough to continue with the tests. However, there are gotchas that you have to watch out for.
Enable “Uptime SLA” Mode
I think this is a bit unclear. GKE has different “grades” of nodes to run the Kubernetes master on. But AKS’s is called the “Uptime SLA” tier. If you don’t enable this, then the default (free) master implementation just isn’t capable of handling hundreds of nodes.
Use the Azure CNI Provider
The default network implementation (kubenet) is only capable of handling clusters with 400 nodes. To enable larger clusters the simplest solution is to use the Azure CNI network provider which uses Azure networking hardware.
Use Multiple Node Pools
The Azure Standard load balancer is limited to a maximum of 1000 nodes. This includes any worker nodes that are used for Kubernetes system pods, so you will have to ensure you are requesting fewer than 1000 nodes.
Results
Eventually, I was able to obtain a 50-minute 1000 node scale-up and down, as shown in the plot below.
The main bottleneck here is are the plateaus in the scale-up/down. We isolated that this was due to backend, internal API issues. Some of the deletion calls took 20 minutes to complete, for example. This feedback was passed on to the backend API teams so it may have improved since then.
The one key setting that I had to change was to increase the deletion performance:
empty_bulk_delete_max = 200
Conclusion
One of the key conclusions in this report is the potential savings that can be achieved with a little experimentation.
The simulated ML training job takes 10 minutes to complete. Using the default settings in many clouds leads to scaling jobs that take anywhere between 1hr30 and 2hrs. The scaling trace looks triangular-ish, so I will be nice and say you’re paying for half of that, or 45min.
In other words, you’re paying for 45 minutes to one hour’s worth of computing time for one 10-minute job. That’s approximately 5x more than you should be.
Using GKE, with optimal settings, the trace is rectangular at takes approximately 20 minutes, or about 2x more than you should be. That represents at least a 2x saving on compute costs.
When scaled up to using 1000 expensive GPU nodes (approx $30 / hour), that 2x saving equates to about $15k. Yes, a $15,000 saving, per training job.
I agree that scaling to 1000 nodes is somewhat exceptional, but it is representative. Training larger models with 100 nodes is a regular occurrence, especially at larger companies. It only takes a handful of jobs to need to scale to 1000 nodes.
Value of This Work
By leveraging Winder.AI’s MLOps development experience, Grid.AI were able to quickly prototype new product ideas. They established that different cloud providers had vastly different costs when it comes to training large scale ML models. We also set the groundwork for the future direction of the product, both technically and strategically, much faster and cheaper than they would have been able to if they had to wait for internal engineering time.
This relationship blossomed into other follow-on work that we will discuss in another case study, demonstrating the trust that we build with our clients.
Contact
If this work is of interest to your organization, then we’d love to talk to you. Please get in touch with the sales team at Winder.AI and we can chat about how we can help you.