Regression: Dealing With Outliers
Regression: Dealing with Outliers
Welcome! This workshop is from Winder.ai. Sign up to receive more free workshops, training and videos.
Outliers are observations that are spurious. You can usually spot outliers visually; they are often far away from the rest of the observations.
Sometimes they are caused by a measurement error, sometimes noise and occasionally they can be observations of interest (e.g. fraud detection).
But outliers skew the estimates of the mean and standard deviation and therefore affect linear models that use error measures that assume normality (e.g. Minimum Squared Error).
# Usual imports
import os
import pandas as pd
import matplotlib.pyplot as plt
import numpy as np
from IPython.display import display
from sklearn.linear_model import LinearRegression
np.random.seed(42)  # To ensure we get the same data every time.
X = 2 * np.random.rand(50, 1)
y = 8 + 6 * X + np.random.randn(50, 1)
y[10:20] = y[10:20] + 10
lin_reg = LinearRegression()
lin_reg.fit(X, y)
lin_reg.intercept_, lin_reg.coef_
(array([ 10.64908656]), array([[ 5.26889785]]))
X_new = np.array([[0], [2]])
y_predict = np.array([lin_reg.intercept_, X_new[1]*lin_reg.coef_ + lin_reg.intercept_])
print(X_new.shape)
print(y_predict.shape)

plt.scatter(X, y, color='red', marker='o')
plt.scatter(X[10:20], y[10:20], color='k', marker='x')
plt.plot(X_new, y_predict, "b-")
plt.xlabel('x')
plt.ylabel('y')
plt.tight_layout()
plt.axis([0, 2, 8, 22])
plt.show()
(2, 1)
(2, 1)
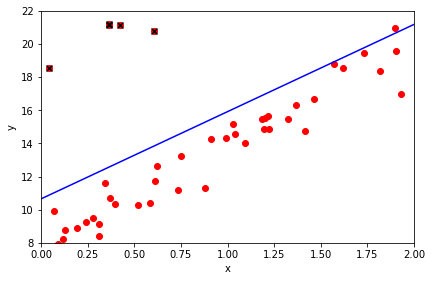
We can see that it has affected the regression. But we can also see that the line of best fit still hugs the original data. This is an interesting lesson. More data mitigates against the effect of outliers.
Still, we can do better.
RANSAC is an algorithm that repeatedly sub-samples the data and then trains the model on that subset. After this has been performed a number of times the parameters are combined in some way to make a more robust estimate. This methodology can be used with any algorithm.
Note that the implemention in SKLearn works a little differently by attempting to select the observations that are not outliers, but the premise is similar.
from sklearn.linear_model import RANSACRegressor

# Robustly fit linear model with RANSAC algorithm
model_ransac = RANSACRegressor(LinearRegression())
model_ransac.fit(X, y)
RANSACRegressor(base_estimator=LinearRegression(copy_X=True, fit_intercept=True, n_jobs=1, normalize=False),
        is_data_valid=None, is_model_valid=None, loss='absolute_loss',
        max_skips=inf, max_trials=100, min_samples=None, random_state=None,
        residual_metric=None, residual_threshold=None, stop_n_inliers=inf,
        stop_probability=0.99, stop_score=inf)
plt.scatter(X, y, color='red', marker='o', label='raw')
plt.plot(X_new, y_predict, "b-", label='MSE')
plt.plot(X_new, model_ransac.predict(X_new), "g-", label='RANSAC')
plt.xlabel('x')
plt.ylabel('y')
plt.legend(loc='upper left')
plt.tight_layout()
plt.axis([0, 2, 8, 22])
plt.show()
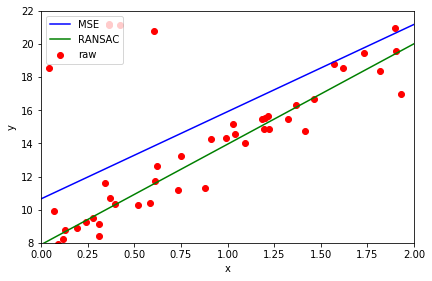
Note the much better fit. How well RANSAC works depends on how many outliers you have, how they are distributed and how close to normally distributed your inliers are.