A Comparison of Machine Learning Model Monitoring Tools and Products
by Dr. Phil Winder , CEO
Machine learning (ML) model monitoring is a crucial part of the MLOps lifecycle. It ensures that your models are performing as expected and that they are not degrading over time. There are many tools available to help you monitor your models, from open-source frameworks to proprietary SaaS solutions. In this article, I’ll compare some of the best open-source and proprietary machine learning model monitoring tools available today.
Introduction To Machine Learning Monitoring
As Artificial intelligence (AI) is becoming a standard part of any software stack, so is the need to implement the same DevOps principles of resiliency, proactivity and paying down technical debt for more sleep. More recently, AI applications have regulatory burdens that enforce the use of monitoring tools to ensure ML models are fit for use.
This article was created thanks to the push from one of our clients who wanted to know what was out there. Our use case was for monitoring “traditional” AI models that include tasks such as classification, regression, and clustering. That means I’ve excluded tools that are focussed solely on monitoring LLMs, which we have already covered in a separate article.
The goal of this article was to serve as an entrypoint for all of these tools. Once you have reviewed my notes and considered them against your own requirements, you should be able to shortlist a few tools to try out. That means many of my opinions are based on the documentation and impressions of the marketing material.
Methodology
I’ve split the tools into three categories: open-source, proprietary, and SaaS. There’s some cross-over between proprietary and SaaS, but I’ve tried to keep them separate. I’ve also tried to focus on dedicated monitoring solutions, rather than more general MLOps platforms that have a monitoring component.
I’ve then reviewed each tool based on the following criteria:
- Do they present themselves as competent and comprehensive? Is it confusing?
- What architecture patterns do they use?
- How are they differentiated from other tools?
- How transparent are they about their capabilities?
- How is it licensed if it is OSS?
Crucially, I have not focussed on cost or on specific use cases or data types (unless they were unique). Rightly or wrongly, many companies base their decisions on what is easiest rather than the best. But in this article I’ve tried to remain as neutral as possible and focus on the above.
Common Themes
I found that most tools follow a similar pattern. They all require you to define a “project” with a model, then set up the project with baseline data. Inference data is then pushed to the platform using an SDK. Metrics are added and visualized through the UI. “Policies” generate alerts that are sent to a variety of alerting systems.
They all tend to support all modelling tasks such as classification, regression, time-series, clustering, and in some cases embeddings. They also all tend to support tabular data, but some also support text and image data. I will call this out when with any exceptions.
What is Model Monitoring?
Model monitoring is the activity of tracking the functional performance of a machine learning model over time. This includes looking at how the input data change, how the model’s predictions change, and ultimately the performance of the model in the real world.
In software, behaviour is largely defined by code and limited user input. This makes them reasonably stable over time. User behaviour can change the requirements of the software, but that usually happens slowly. In contract, AI models have little code and mostly consist of learnt behaviours based upon data. Therefore, misunderstandings of the original model, changes in the real world, or differing user behaviour can cause the model to degrade over time. Ultimately, this could mean that the model is no longer fit for purpose.
The specific calculations, algorithms, and implementations depend heavily on the data type and modelling task. For example, you’d use different metrics to track categorical variables in a classification model than you would for time series data in a regression model. I do not focus much on this because most tools support the same metrics and algorithms. If they don’t, it’s usually easy to find an open-source library that does and implement a custom metric.
Note that traditional monitoring tools are often also used to measure non-functional metrics such as latency, throughput, and error rates. These are important, but they are not the focus of this article.
Open Source Model Monitoring Frameworks
First I focus on open-source model monitoring frameworks. These are ranked by GitHub stars, which is a crude indicator of popularity because it’s easy to buy or promote stars in a voting-ring. More popular open-source projects are more likely to be better maintained and have a larger community for support. If they are backed by a company, then that’s even better because you can get paid support and they are more likely to stick around.
TL;DR; Evidently OSS is the only viable open-source option for monitoring traditional ML models.
Evidently OSS
 |  |
|---|
Evidently isn’t exactly the oldest company dedicated to monitoring in this list, but it feels like they have the most brand awareness. It’s nice to see that they aren’t VC-backed yet. They have a SaaS platform but crucially, they also provide an open-source version.
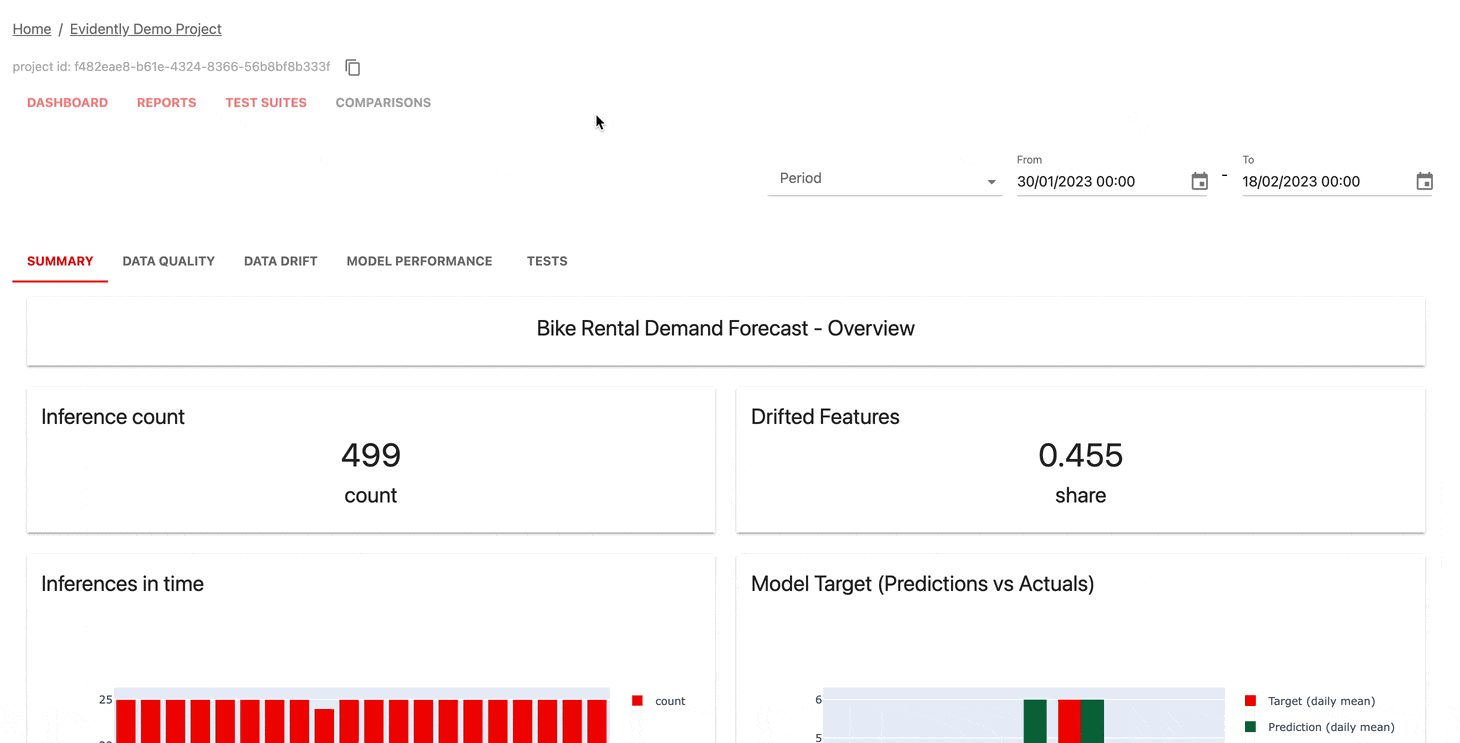
It’s Apache-2.0 licensed so no issues there and they provide, although don’t exactly signpost, a simple single container to act as a collector and to host the UI. There’s an example docker-compose file in the repo to help you get started or you can try the online demo.
Evidently OSS has a nice, but simple, dashboard to help you analyze your models. It supports tabular and text-like data types, but crucially does not support any raw image formats. It supports all the usual model types.
There’s two ways to run a monitoring job. You can either do it in batch mode or use a collector to push predictions to the monitoring service in real-time.
In batch mode, you need some python code to build a “snapshot” that is then pushed to the monitoring service. Snapshots are basically an opinionated object that contains predictions and ground truth. If you have an external data store where predictions are stored, you could run this job on a cron to pull recent data and push it in a snapshot to the monitoring service.
In real-time mode, you push inference data to a collector service as it happens. You can also run external jobs to push ground truth later, when you have them.
Data is stored in using the fsspec library, which means you can store data in a variety of places, including Databricks, S3, GCS, and local disk.
Other things I noticed were some interesting CI/CD integrations, some support for running large analyses on Spark, and some early support for tracing.
Overall Evidently OSS differentiates itself by providing (arguably) the best open-source set of features. It’s also the most transparent about its capabilities. The fact that it’s backed by Evidently might also be a positive if you’re interested in open-core, but commercial support like options.
Deepchecks
 |  |
|---|
Deepchecks began as an interesting prospect. But I was fooled by the attached repository. This repository isn’t a monitoring product; it’s more of a model testing solution. The monitoring solution is hosted in a separate repository and has 14 stars. Okay. Shortly after that I found that it had a complicated license structure.
First off, most of it is licenced AGPL. This is a big issue for enterprises.
Secondly, I’m confused about the OSS version that says that it’s for toy use only. The documentation says “this won’t scale to support real-time production usage.” So I think the OSS version is just a demo for their SaaS. There’s also a worrying lack of issues on GitHub, likely because of this confusion.
On a more positive note, Deepchecks differentiates itself by taking a more holistic view of testing throughout the lifecycle of a model. It has an interesting integration with GitHub for direct GitOps integration.
It has several deployment options: SaaS, an open-source, and managed on-prem solution. The architecture is a bit complicated, but because it comes pre-baked with OAuth, Postgres, Kafka, and Redis, it’s likely to be a powerful, yet complicated, stack.
Overall an interesting proposition, but it’s not viable to use the OSS version in a commercial setting. The fact that I’m looking for monitoring solutions here, not testing, means that it probably shouldn’t have made the list. But I thought it was worth including anyway.
Whylogs
 |  |
|---|
WhyLogs is a Python library that helps you log data and track dataset changes. It’s open-source and has a tight integration with WhyLabs, which is a commercial monitoring solution. It’s Apache-2.0 licensed. So please note it does not do any monitoring itself, it’s more of a logging library.
There’s a nice example of pushing profile information to MLFlow during training time.
But basically this is just an SDK for WhyLabs.
NannyML
 |  |
|---|
NannyML is an interesting Python library for analysing drift. It differentiates itself by suggesting it’s better able to predict prediction drift before the actuals arrive.
This could be really useful if you have a use case where actuals are hard to get or delayed. This is achieved by comparing the distribution of predictions to the distribution of predictions in the training data. There’s also a way to take the actuals when they do arrive and calculate the realized performance.
However, this is just a python library for notebook analysis. If you wanted to generate these results on a regular basis then you’ll need to configure a job to do that and push the results elsewhere.
DataProfiler
 |  |
|---|
This is another Python library that specializes in profiling data. It has a nice PII detection feature, but not much else in terms of monitoring.
Polyaxon TraceML
 |  |
|---|
This is an open-source component of a larger framework. It’s Apache-2.0 licenced, but there doesn’t appear to be much development here yet. It’s mostly focussed on tracking training, not monitoring.
Radicalbit AI Monitoring
 |  |
|---|
This is another new project but thankfully it does have monitoring components. It’s Apache-2.0 licenced.
One of the biggest interesting design decisions is that it uses Spark for compute. This could be a big differentiator if you’re already using Spark for your data processing. It also has a UI and a UI workflow to create models and capture data. It stores data in Postgres.
It supports limited data and model types. It has very limited drift and monitoring capabilities.
Overall, this is a project to watch.
Proprietary Model Monitoring Tools
Next I focus on proprietary model monitoring tools. Here I mainly focus on the offerings from the hyper-scalers. If you’re heavily embedded with using managed services and you don’t want to risk using a smaller vendor, then this is the section for you.
TL;DR All cloud providers have a monitoring solution but most expect you to have pro DevOps skills. Databricks is running the tightrope of trying to operate on all clouds in an integrated way and represents an interesting competitor to the clouds themselves.
Databricks
Databricks is the SQL-focussed juggernaut that I remember visiting in their small Amsterdam office all those years ago. They’ve take a lot of VC funding and come a long way since then. They are now a major player in the ML space and, crucially, are supported across the big three cloud providers.
Databricks doesn’t have a dedicated ML monitoring product, but you can write your own code to create a job that logs predictions to a delta table. You can then use Lakehouse Monitoring to monitor drift and performance.
The general idea is to log “inference tables”, which are similar to profiles in WhyLogs and snapshots in Evidently. (Why must everyone have their own name for this?)
You can then analyse these tables using code and write them back to another table. Then you can use SQL to analyse and present the results. This setup is ultimately flexible and removes the a lot of worry about data storage because that is Databricks’ bread and butter. You can setup alerts based upon SQL cron jobs and create dashboards to visualize the results.
Databricks provides the tools, but doesn’t make it easy. If you’re heavily locked into Databricks already, then this might be an option. For everyone else, it’s probably too much hassle to justify and presents a humongous lock-in risk.
Amazon SageMaker Model Monitoring
Sagemaker is similarly flexible, but with a more opinionated approach. You can use SageMaker Model Monitoring to monitor your models. This is a more complete solution than Databricks, but is in some ways also more opinionated.
Like databricks it focuses on creating webs of jobs that log data to S3. Notebooks are also again at the forefront of processing and analysis. To create an monitoring pipeline you would create various monitoring jobs to look parse logged inference requests and store them in a location ready for CloudWatch to visualize and alert upon.
If you’re already embedded in the AWS ecosystem, then this might be a good option. But, like Databricks, it’s a big lock-in risk.
I think another challenge with this approach is that it extracts the monitoring complexity into DevOps, rather than the data scientists themselves. To make this work you need complicated, opinionated pipelines that ultimately connect to a clunky monitoring system (CloudWatch). I think it’s safe to say that data scientists don’t want to be DevOps engineers and won’t like this setup. This disincentivizes data scientists to do monitoring, which ultimately this affects the quality product. Or viewing from the other side, your DevOps team will need to become data science pros immediately.
Databricks and AWS both attempt to smooth over this problem by using notebooks for everything. By using notebooks they’re trying to say “data scientists can do DevOps because our examples are in notebooks.” But this is a plaster over a seeping wound. I believe that notebooks are bad for DevOps for the same reasons why they are bad for production. They are hard to version, hard to test, hard to share, and hard to maintain.
Also note there’s quite a few caveats on what can be monitored depending on the specific combination of data type and task.
Azure ML
Azure ML has a setup similar to AWS where you use an SDK to write logs that are written to blob storage and then processed by a monitoring job. But thankfully (IMO) they’ve exposed this configuration as configuration (YAML) rather than SDK code as well as providing point-and-click options.

Once configured, the input and output data is managed by Azure themselves and fed into the monitoring suite, which is a plus. The downside is that Azure ML Monitoring only works (out of the box) with either Azure Machine Learning endpoints (managed or Kubernetes (AKS)). If you’re deploying elsewhere you need to push data using the SDK. There’s also a significant amount of work to get actuals pushing to Azure ML which you would need to do yourself. But to be fair, that’s true of all monitoring solutions.
One thing that I believe is missing from Azure ML are examples of analysing the monitoring data. They say that the log data is in blob storage, but what about the metrics? Are they accessible? Can you view them in a dashboard? I couldn’t find any information on this.
Google Vertex AI
Depending on how much flexibility you need, Vertex AI is possibly my favourite cloud vendor offering, from a data scientist’s perspective, because it’s so opinionated. If Vertex AI meets your model serving needs then monitoring is as simple as clicking a few buttons. Of course where it falls short is when you start having more complex requirements.
SaaS Model Monitoring Solutions
SaaS solutions are the most common monitoring products. They are usually the easiest to use and the most feature-rich. Some of them are also the least transparent, so you need to balance the ease of use with your transparency requirements. I’ve ordered these alphabetically because I don’t have a good way to rank them.
Aporia
Despite an obvious drive towards LLMs, Aporia started with a more traditional model monitoring solution.
Aporia connects directly to your serving data sources and defaults to pulling data from a database or file store. It has a pretty sophisticated streaming option if you’re serving billions of predictions per day that is unique across vendors.
There’s an interesting section in the docs that talks about deployment. Up to now I had assumed it was a SaaS. The deployment docs are behind a paywall, so I can’t see how complicated the stack is. Maybe this is on-prem? Not sure.
I’m also really confused by all the LLM messaging on the main website. There’s no clear signposting of this traditional MLOps part of Aporia. So that’s a risk too; are they deprecating it? Are they only focussing on LLMs now?
Arize AI
Arize first jumped on my radar due to its open-source Pheonix LLM monitoring solution. But they also have a SaaS offering that includes “traditional” model monitoring too.

What’s nice about Arize is that it doesn’t have any serving opinions. You aren’t forced to use a serving product they own or any specific provider. They have SDKs that allow you to push your data from wherever you like. It also has an import capability from Databricks, SageMaker, Vertex AI, etc. So if your data/logs are already in one of these places then you can easily import them.
Once your data is in the platform it has fully managed solutions for all the usual monitoring calculations and visualizations. It has a nice alerting system that can be configured to send alerts to Slack, PagerDuty, etc. It also has a few other nice to haves like explainability modules and fairness testing.
Definitely worth a demo.
Censius
Censius have a monitoring product but their documentation isn’t signposted. Thankfully my l33t hacking skills found the monitoring docs where you’d expect.
They group models into projects and include datasets and segments (like Mona). This is all done via the UI. Inference time logging is performed via a Python SDK.
But crucially, that’s it. There isn’t any description about the data or model types. They talk about data drift and concept drift, but they don’t say how they do that.
They do have the beginnings of an analytics-type dashboard, but it’s not as comprehensive as Mona’s. I also can’t see anything about alerting or integrations.
So overall I get the impression that Censius has a good start, but it’s not as comprehensive as some of the other SaaS offerings and they either need to a) differentiate more, or b) catch up.
Fiddler
Fiddler begins with clear messaging on deployment options. They all target Kubernetes but they offer SaaS, on-prem, and self-hosted options. It is paywalled behind a Docker registry configuration.
Fiddler contains a suite of UI driven dashboards, alerts, and model onboarding. SDKs are also provided. Data is consumed by pushing to Fiddler from your serving layer using the SDK.
Overall, there’s nothing surprising here, which is good. It looks well executed and is certainly worth a demo.
Mona
Mona stands out on one front. It has a comprehensive “Investigations” page that looks a lot like an analytics dashboard. It’s basically an analytics dashboard for your AI monitoring and that’s a great idea. Other providers often have the capability, but don’t present this out of the box. There’s more analytics in the “Insight generation” too.

Another feature that’s interesting is the ability to backfill predictions. It’s fairly likely you already have (tens?) of models in production if you’re looking for a more comprehensive monitoring solution. This feature allows you to backfill predictions based upon your current logs to backfill the monitoring data.
On the data side, Mona stands out because of its support for geospatial data. This is a big deal if you’re in the geospatial business.
One thing that caught me off guard was that you import your inference time data via the “Export your data” functionality. If anyone from Mona is reading this, please change that to “Import your data.” Or Ingest, or something. Export, from within the context of the Mona documentation, means to take data out of Mona. Oh no, the API is called /export too. Posting to /export with your data to import into Mona requires a lot of mental gymnastics.
Moving on, the data types, the alerting systems, and the detection methodologies are all very familiar. The model is configured, ultimately, by a JSON file. They have user-defined segments (like Censius) that help you check for bias. There isn’t any talk of deployment, so I assume this is full-on SaaS.
Overall Mona has an interesting analytics-first take on monitoring that differentiates it slightly from other SaaS offerings.
Qualdo
I would have loved to have reviewed Qualdo, but their docs are paywalled.
Seldon
I have a soft spot for Seldon because (a) they’re based in the UK and I’ve worked with/on/in/over projects where they have been involved and thoroughly enjoyed it, and (b) they have a long history of supporting open-source. For example we’ve relied on KServe for as long as I can remember and we owe a lot of that to Seldon.
Although Seldon focuses on serving, they have a range of solutions related to monitoring, like serving, governance, etc. For the purposes of this article I will focus on their monitoring solution, Alibi.
Alibi is a vast Python library that provides an SDK to do a lot of the monitoring tasks that you would expect. It could be used independently with KServe, for example, but it is not open-source, you need a license. It integrates with Seldon core via a payload logger.
So you see it is loosely coupled with Seldon Core, but because it’s licensed it probably makes sense to use it with Seldon Core. In terms of differentiation, Seldon are probably the most “open” of the commercial offerings here. I personally think that transparency such as this is the best way to go in the long term.
Seldon is probably a bit closer to the metal than many of the SaaS offerings here, but it’s also more flexible. If you’re already committed to Kubernetes and you want to run on prem, then Seldon is a good choice.
Superwise
Firstly, they have a free community edition, which is a great low-barrier way to test it out.
Again, it follows the pattern of defining a “project” with a model then setting up the project with baseline data. Inference data is then pushed to the platform using an SDK.
Metrics are added and visualized through the UI. “Policies” generate alerts that are sent to a variety of alerting systems.
Again, all very standard, but well executed. The free edition is worth a demo.
Conclusions
Evidently OSS is the most interesting product because of the high level of transparency. But it’s clear that the SaaS offerings are probably much easier to get started with and some have very comprehensive features. Lastly if you’re already embedded with your cloud provider and you are or have a team of cloud DevOps engineers, then the cloud provider’s monitoring solution might be good for you.
As always, what’s best for you depends on your unique requirements. But I hope this article has helped you to shortlist some interesting solutions to try out.
If you have any corrections or feedback then please let me know.
If you or your company are looking for help with MLOps, then please get in touch. Our AI consulting services cover the full lifecycle from model development through to production monitoring and governance.
Other Interesting Out Of Scope Tools I Found
The following tools cropped up during my research, but I didn’t include them in the main list because they didn’t fit the criteria of being a monitoring tool. However, they are interesting and might be useful to you.
Testing
- Great Expectations: Helps data teams eliminate pipeline debt, through data testing, documentation, and profiling. Apache-2.0
- Pandera: A light-weight, flexible, and expressive data validation library for dataframes.
- Soda Core: Data profiling, testing, and monitoring for SQL accessible data.
Observability
- Netron: Visualizer for neural network, deep learning, and machine learning models.
Data Analysis
- Manifold: A model-agnostic visual debugging tool for machine learning.
- Pandas Profiling: Extends the pandas DataFrame with df.profile_report() for quick data analysis.
- Yellowbrick: Visual analysis and diagnostic tools to facilitate machine learning model selection.
Data Cleaning
- ydata-quality: Data Quality assessment with one line of code.
Frequently asked questions
Model monitoring in machine learning is the act of tracking production metrics and data to ensure that AI applications are operating as expected. This includes monitoring the input data, the model’s predictions, and the model’s performance in the real world.
In engineering terms, model monitoring is important because it provides confidence that the business use case is being met. In regulatory terms, model monitoring is important because it helps to keep AI applications compliant and users safe.