Quantitative Model Evaluation
To be able to create models, you need to know how to compare them. In this python notebook you will learn how to compare models quantitatively. I.e. create summary statistics for your model's performance.

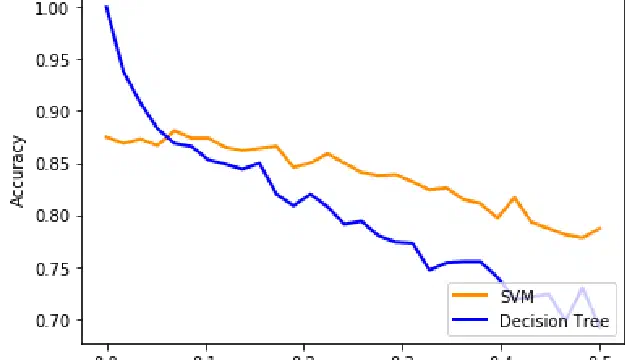
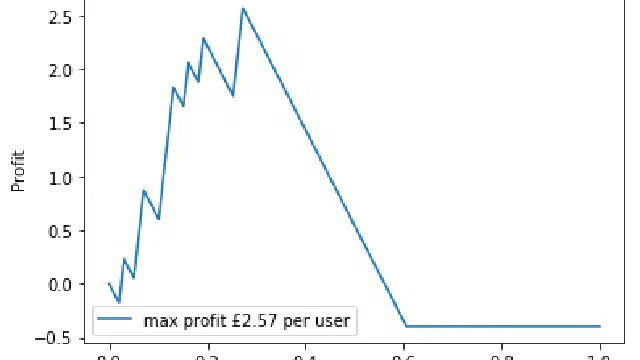
You should always try and visualise your data science. Especially when measuring model performance because this allows you to easily compare and spot errors with models. This Python Notebook shows you visualise model performance.

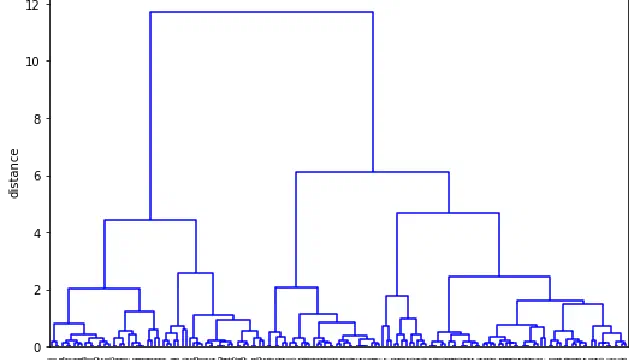
Often data is produced by a process that has some natural hierarchy. If you have a clustering problem where this is true, hierarchical clustering works really well. Find out more in this Python Notebook.

Probabilistic models are great at promoting good science. I.e. we're trying to model features to predict outputs. In this Python Notebook you will learn how to calculate bayes rule and use a naive bayes classifier.

A quick Python Notebook to show you how to use statsmodels to detrend seasonal data.

Most of the time you have too many dimensions to simply plot the decision boundary of a classifier. This workshop investigates other ways to visualise under and overfitting in high-dimensional datasets.
Nearest neighbour algorithms are useful for all kinds of problems. This python notebook explains what it is and how to use it.

We can use the nearest neighbour algorithm for classification too. This python notebook explains how to perform the k-Nearest Neighbours algorithm.
Learn how to monitor microservices with Prometheus. Expert-led introduction from Phil Winder.
Dr. Phil Winder
/
7 minMonitoring != Logging != Tracing. Learn the differences between these three fundamental cloud-native concepts. Find out the uses cases for each technology.
Dr. Phil Winder
/
2 minCase studies and industry analysis from our team. No hype, roughly monthly.