503: Visualising Overfitting in High Dimensional Problems
Validation curve
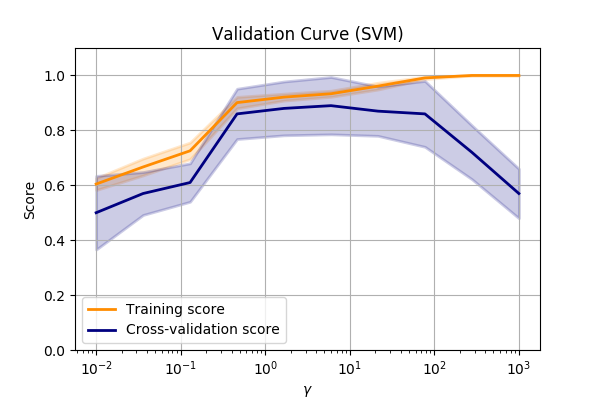
One simple method of visualising overfitting is with a validation curve, (a.k.a fitting curve).
This is a plot of a score (e.g. accuracy) verses some parameter in the model.
Let’s compare the make_circles dataset again and vary the SVM->RBF->gamma value.
???
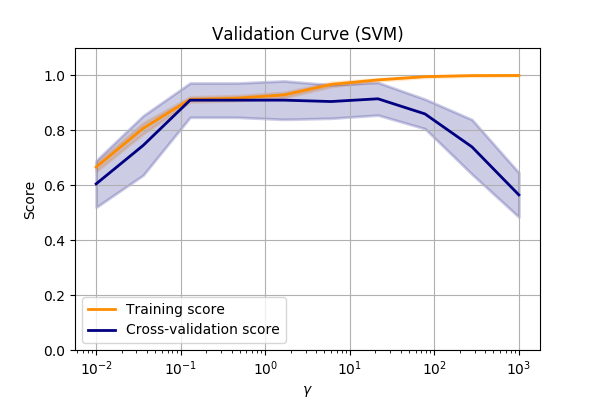
Performance of the SVM->RBF algorithm when altering the parameters of the RBF.
We can see that we are underfitting at low values of \(\gamma\). So we can make the model more complex by allowing the SVM to fit smaller and smaller kernels.
But when we get to a value of about 10, we can see that the performance on our validation set
drops off dramatically.
Learning curves
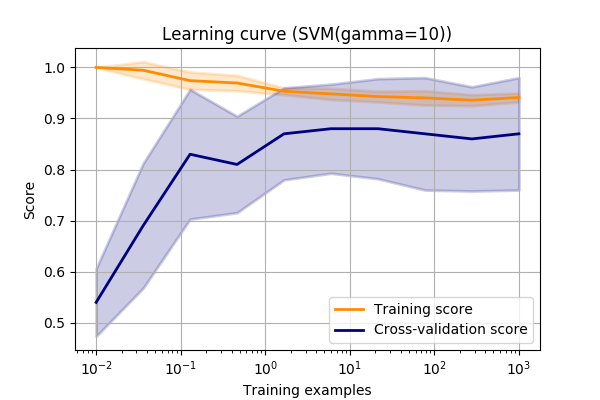
Another way to observe overfitting is with a learning curve.
A learning curve is a plot of the score vs. the amount of data used in the model.
(Or occasionally, in iterative training like deep learning, a plot of score vs. the iteration number is plotted with a similar result)
Again, let’s look at the make_circles dataset again and vary the SVM->RBF->gamma value.
???
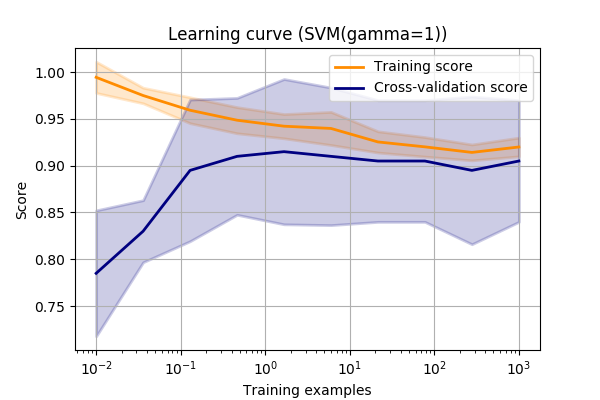
This curve shows us a few things.
Firstly, we can see that the final scores are approximately the same as the validation curve for this value of gamma (always good to sanity check!).
Next, we can see that the training score isn’t quite 1.0.
I.e. it’s not quite modelling the test data exactly. This could mean one of a few things.
It could mean that we aren’t using a complex enough model to capture all the complexity in the data. This is call model bias.
Alternatively, it could mean that the problem isn’t separable. There are some instances that really look like the other class.
E.g. A person really was worthy of giving a loan, but they’ve had an accident and aren’t able to work.
It could just be due to noisy data. Maybe you’re IoT sensor doesn’t give perfect readings.
In the first case, we could try a more complex model. It’s always worth a try.
For second and third case, you may benefit from more data or this result might be typical for the domain.
One final use is that we can use the learning curve to decide whether adding more data is likely to improve the results.
If the validation score is much lower than the training score, then we can improve results by adding more data.
However, if the validation score matches the training data, then we know that we are performing at the best of our abilities.
No amount of new data will improve the score with the given model.
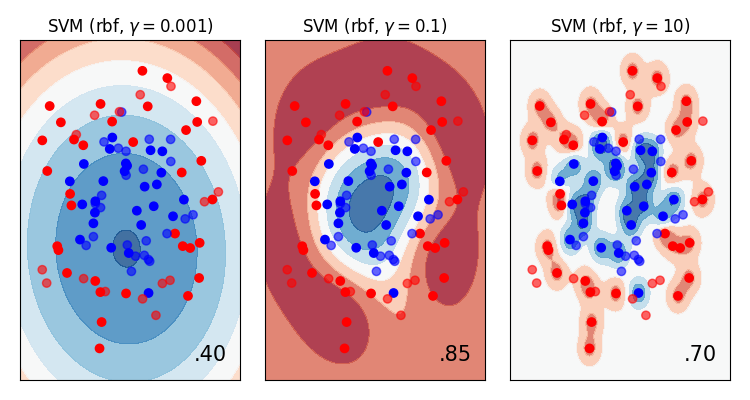
Let’s take another look at the SVM data vs. gamma…
From the validation and learning curves, we can draw these conclusions:
- We are overfitting at high values of gamma
- We need more data to make better generalisations
- There is some noise in the dataset
We can confirm these conclusions by plotting the data directly (which often isn’t possible!)
More data usually means better generalisation
- As a general rule of thumb, more data means better generalisation.
We need more data to “fill in the gaps”.
This compensates for more complex models.
???
We now have models that can model arbitrary complexities (e.g. deep learning, k-nearest neighbours) so we need more and more data to ensure that we continue to generalise to new observations.
For example, let’s increase the number of datapoints in the circles dataset and re-plot the validation and fitting curves…
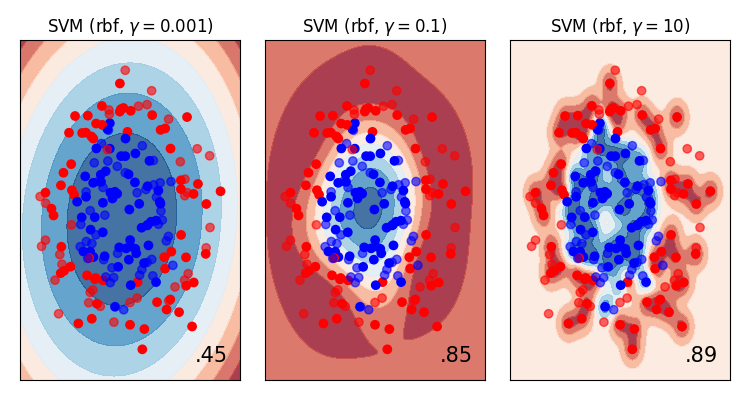
The same make_circle data with 200 observations (as opposed to 100).
- More data has improved the validation score at higher values of gamma.
- Our hunch about overfitting at high values of gamma was correct. Around a value of
1the training and validation scores diverge.
Now, with a new value of gamma=1 and more data, we get much closer to the training data (better
generalisation) without overfitting.
Model complexity
A quick note on complexity (we’ve mentioned it a few times).
Different model types have differing abilities to model complex data. For example a polynomial classifier has more complexity that a linear one.
This is referred to as the variance of the model. (I prefer the term complexity)
Clearly, there is a trade-off between generalisation and complexity, (a.k.a. bias and variance).
You can try to fit data better with a more complex model, but you will probably won’t generalise well to new models.
This is a careful balancing act.
Parameters vs. hyperparameters
Parameters define a model that are learned during the training process.
- e.g. linear coefficients, decision hyperplanes
Hyperparameters are higher level concepts about the model that cannot be learned from the data directly
- e.g. Learning rate, number of leaves in a tree, gamma in RBF-SVM
Hyperparameters often require repeated runs to obtain optimal values.
Hyperparameter optimisation
We’ve seen how model parameters can be learned by minimising a cost function.
But hyperparameters cannot be learned directly from the data.
Instead we often perform a search to find the best parameters.
The simplest form is called a grid search. This is a brute force approach where we try all combinations of hyperparameters and pick (maybe by visualising) the best combination.
Regularisation
Finally, one note about how most models attempt to avoid overfitting.
They introduce regularisation.
This is the practice of actively penalising models with too much complexity.
How regularisation is implemented is different for each model, but the gist is the same:
Occam’s Razor / Law of parsimony
Prefer the simplest model