301: Data Engineering
Your job depends on your data
The goal of this section is to:
- Talk about what data is and the context provided by your domain
- Discover how to massage data to produce the best results
- Find out how and where we can discover new data
???
If you have inadequate data you will not be able to succeed in any data science task.
More generally, I want you to focus on your data. It is necessary to understand your data before building a model.
Each algorithm has different characteristics that work better with certain types of data.
Data in your domain
- Engineers are often not domain experts
- You need to be
The best models are the simplest models
Tip: Domain experts already use models, find out what they are
???
One important aspect that is often overlooked is experience within a domain.
Engineers are often not domain experts. This affects their ability to question data, build models and assess results.
For example, is a 53% accuracy (just better than flipping a coin) in predicting the direction of the stock market good or bad? (Hint: it’s good)
When you are not an expert in the domain of the data, either learn to be an expert or make sure you find someone who is.
Think of data as an asset
Data, and the ability to extract valuable knowledge from data, should be regarded as a strategic asset
???
Too often, data science projects are started on the premise of extracting value from existing data.
Current data might not be the best data to perform a new task.
Always consider whether it would be easier and/or cheaper to collect new data, rather than trying to hammer circular data into a square hole.
Companies that are driven by data are more efficient; hence more profitable more quickly.
Investments in data, data science and engineers pays dividends.
Can be costly and time consuming
Do not underestimate the cost (usually in time) that it takes to collect, parse and understand the data.
???
The cost of acquiring data can vary. Some data is free, some data will need to be purchased. Some data will need a bespoke process to collect.
It is worth spending time to ascertain whether the costs and benefits of collecting and using data are worthwhile.
Collecting and investigating data is a significant, if not one of the largest uses of time in data science. Because the data are so fundamental to a problem, large gains can be found at a very low level. For example, adding, altering or removing features.
Must understand the data
Once the data is collected, it must be understood.
- What are you expecting? (your priors)
- When is that data available? (data leakage)
- What type of data is it? (continuous or categorical, stochastic or set?)
Tip: Do things manually first. Then you can validate automation.
???
You cannot expect to run data you do not understand through an algorithm and get a result.
First, you need to know what sort of result you should be expecting. Only you can tell whether the results are promising or misleading; no number of metrics can do that (yet!).
Furthermore, some algorithms are better suited to certain types of data.
For example, you wouldn’t trying to push complex categorical data through a linear model. And you should notice if one of the observations are clearly erroneous.
All of this is only possible if you understand the data that is going into the model.
Bias in data collection
- Is the data representative?
- Is common-knowledge really that common?
- How was the data recorded? Has that created a subset?
Tip: Assume that you are biased. Assume that the data is biased.
???
Do not be fooled into thinking that the data represents the objective truth.
Like “there is no such thing as 100%”, there is also no such thing as a representative dataset.
One common example is the black swan theory. The word “black swan” was a common expression up to 17th century, which had a similar meaning to what “when pigs fly” means today. In 1697 Dutch explorers found a black swan in Australia.
More routinely though, biases creep into data collection. For example, if we were handed a dataset from a bank, with information about people that were given a loan, a common question might be “what sort of people should we give a loan to”.
But of course, the data is biased. It only contains information about loans decided upon by a previous person or policy.
Be sure that your data is a good (enough) representation of the entire population, not just a subset.
Preprocessing data
- Black boxes don’t work. Expert models might work.
- No free lunch
Preprocessing data is the task of taking the raw data and attempting to fit the data to those assumptions so the algorithm can do its job more effectively.
???
Once the data has been collected we cannot simply throw the data into a black box and expect to produce something meaningful.
A theory exists called “no free lunch” which states (in a highly mathematical way) that no one technique (algorithm, optimisation function, etc.) can perform equally well on all kinds of data.
We create models to simplify the real world. To distill a set of measurements into a form that is easier to understand. All models make certain assumptions during this simplification.
Preprocessing data is the task of taking the raw data and attempting to fit the data to those assumptions so the algorithm can do its job more effectively.
Characteristics of your data
- Statistics 101
- All data has some “character”
- We need to visualise that character to improve our understanding of the data
- Histograms are one way of doing this
The mean and standard deviation are measures of that character.
???
Before we start massaging the data into shape, lets have a quick statistics lesson.
Each feature that we sample has a character. It produces values in very characteristic ways. It is uncommon for values to be produced that are uncharacteristic.
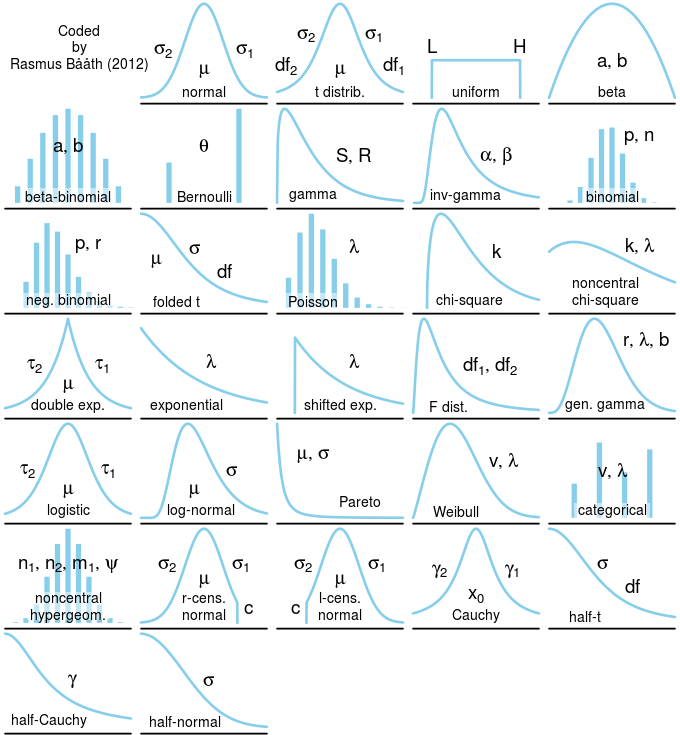
If we take the values of the feature, and assign them to bins, we can count the number of times a value falls into a bin. This is called a histogram.
Histograms expose the true nature of the data, that the data is formed by some natural process. The underlying model that produces this data is called a distribution. It perfectly describes any new potential value that could arise from that process in only a handful of numbers.


The bad news
Many algorithms, from optimisers to learning algorithms, assume that your data is normally distributed
???
- Spend time trying to normalise your data (performing tricks to make the data look more normal)
- Be aware of when your data isn’t normal, bare that in mind when running through algorithms
- Some types of data might have a different distribution and that distribution is inherent to the problem. Don’t try to normalise this data.
- Plotting histograms of the features allows you to “get a feeling” for the data. Even if you don’t use it to improve the data, it is essential for data understanding.
- Histograms might reveal important characteristics within the data. For example, are there groups of data?
- Histograms are also an important first step of visualising problem data
Scaling
Nearly all algorithms expect your data to have equal scales.
- Due to scale being interpreted as “important”
(Decision trees are one of the only algorithms that you can ignore scale)
???
Many (in fact, all except for decision trees) algorithms expect the data in a certain format. Chief among these is the requirement for all features to have the same scale.
Imagine we are fitting a two dimensional linear model to some data. Linear algorithms do their job by minimising the error between the predicted result and the data.
If one of the features is ten times larger than the other, then the errors produced by a prediction would also be \(10^2\) larger. Hence, the optimisation algorithm trying to minimise that error will spend more time trying to reduce the larger error, because that is the larger “slope”.
Obviously this is wrong, we don’t want to treat any features as more important than another (unless we do, and if we do there’s better ways of doing it).
To fix the problem, we need to scale the larger feature so it has similar characteristics to the smaller.
class: pure-table, pure-table-striped
Scaling options
| Name | Result | When? |
|---|---|---|
| StandardScaler | Zero mean and variance of one | Most of the time |
| MinMaxScaler, MaxAbsScaler | Rescale feature to lie between zero and one | When data really can be zero, catagorical values |
| RobustScaler | A version of StandardScaler that is less sensitive to outliers | When there are outliers |
Most of the time we will use the StandardScaler. Lets look at an example…
class: middle
Example

Missing values
Most if not all algorithms expect data to be numeric and that they have meaning.
- Remove rows or columns
- Impute missing values
???
Most real world data is not perfect. It has missing or invalid values like blanks, NaNs, or Nulls.
The first strategy, and the simplest if you can afford it, is to drop the observations that have invalid data.
If you can’t drop data, we can attempt to fill or impute the values; i.e. infer them from the known part of the data.
>>> import numpy as np
>>> from sklearn.preprocessing import Imputer
>>> imp = Imputer(missing_values='NaN', strategy='mean', axis=0)
>>> imp.fit([[1, 2], [np.nan, 3], [7, 6]])
Imputer(axis=0, copy=True, missing_values='NaN', strategy='mean', verbose=0)
>>> X = [[np.nan, 2], [6, np.nan], [7, 6]]
>>> print(imp.transform(X))
[[ 4.          2.        ]
 [ 6.          3.666...]
 [ 7.          6.        ]]
class: pure-table, pure-table-striped
Categorical features
If necessary, we can convert categorical features into continuous ones:
- Create new columns for each possible category
X = [
    {'sex': 'female', 'location': 'Europe', 'age': 33},
    {'sex': 'male', 'location': 'US', 'age': 65},
    {'sex': 'female', 'location': 'Asia', 'age': 48},
]
| age | location=Asia | location=Europe | location=US | sex=female | sex=male |
|---|---|---|---|---|---|
| 33.0 | 0.0 | 1.0 | 0.0 | 1.0 | 0.0 |
| 65.0 | 0.0 | 0.0 | 1.0 | 0.0 | 1.0 |
| 48.0 | 1.0 | 0.0 | 0.0 | 1.0 | 0.0 |
???
When data is presented as a dictionary, we can use a DictVectorizer.
from sklearn.feature_extraction import DictVectorizer

X = [
    {'sex': 'female', 'location': 'Europe', 'age': 33},
    {'sex': 'male', 'location': 'US', 'age': 65},
    {'sex': 'female', 'location': 'Asia', 'age': 48},
]
vec = DictVectorizer()
X_v = vec.fit_transform(X).toarray()
df = pd.DataFrame(X_v, columns=vec.feature_names_)
print(pandas_df_to_markdown_table(df).data)
| age | location=Asia | location=Europe | location=US | sex=female | sex=male |
|---|---|---|---|---|---|
| 33.0 | 0.0 | 1.0 | 0.0 | 1.0 | 0.0 |
| 65.0 | 0.0 | 0.0 | 1.0 | 0.0 | 1.0 |
| 48.0 | 1.0 | 0.0 | 0.0 | 1.0 | 0.0 |
Also see: pandas.get_dummies() performs a similar function.
Sometimes data is not presented as a dictionary, but still catagorical. For example, consider the previous example where we have used a numerical value that represents the different characteristics of the people (0 = ‘female’, 1 = ‘male’, etc.)
from sklearn.preprocessing import OneHotEncoder

X_v = [[33, 0, 0], [65, 1, 1], [48, 0, 2]]
enc = OneHotEncoder()
X_e = enc.fit_transform(X_v)
print("One hot encoded\n", X_e.toarray())

One hot encoded
 [[ 1.  0.  0.  1.  0.  1.  0.  0.]
 [ 0.  0.  1.  0.  1.  0.  1.  0.]
 [ 0.  1.  0.  1.  0.  0.  0.  1.]]
class: pure-table, pure-table-striped
Creating Categories
Sometimes it helps to add categories, rather than working with continuous variables.
- Create bins, like a histogram, and use a 1 to signify the bin
| age | 0-10 | 10-20 | 20-30 | 30-40 | 40-50 |
|---|---|---|---|---|---|
| 33.0 | 0.0 | 1.0 | 0.0 | 0.0 | 0.0 |
| 65.0 | 0.0 | 0.0 | 1.0 | 0.0 | 0.0 |
| 48.0 | 0.0 | 0.0 | 0.0 | 1.0 | 0.0 |
Save your preprocessors
A quick note: remember to keep track of your preprocessors!
Because you’ve trained your models on this preprocessed data, the model will only work on data that has also been preprocessed. I.e. you also need to perform the same preprocessing on new data.